Your leads aren’t drying up because people don’t care; it’s your funnel that leaks. If your growth feels random, it’s because your marketing isn’t running on data.
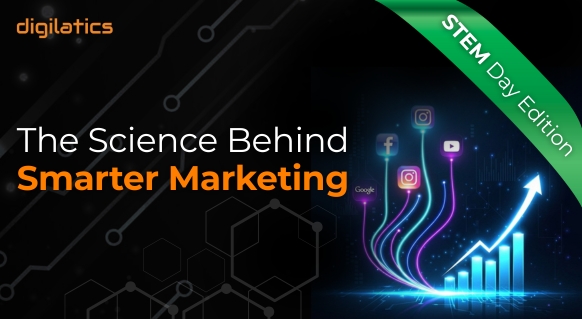
Marketing isn’t magic, it’s science. And the smartest marketers know it. STEM isn’t just for scientists; it’s how smart marketers think, test, and grow all year round.
In marketing, funnels are your formula, A/B tests are your experiments, and data is your microscope. Just like in a lab, every campaign you run is a test. And growth comes not from guessing, but from measuring and optimizing.
The businesses that win aren’t the ones chasing trends. They’re the ones testing, tracking, and refining until they find the formula that consistently turns clicks into customers.
This blog isn’t about “growth hacks.” It’s about applying the scientific method to your marketing.
Funnels = Your Marketing Formula

A funnel is marketing’s version of the scientific method: each stage is a step in testing whether a prospect is ready to convert.
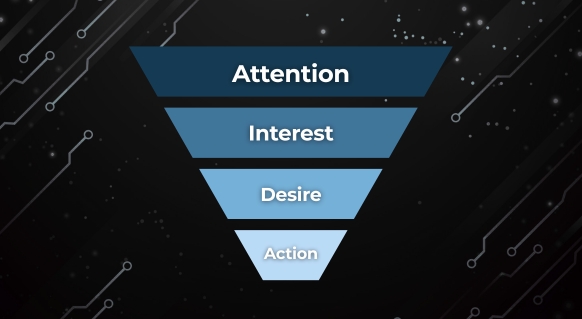
The classic framework is AIDA — Awareness, Interest, Desire, Action.
Think of it like running an experiment in the lab:
- Awareness = Hypothesis
At the top of the funnel, your goal is simple: spark curiosity. SEO, ads, and content put your brand under the microscope. Do people notice? Do they care? That’s your first hypothesis. - Interest = Data Collection
Once they’re aware, you start gathering proof of interest. Lead magnets, nurture emails, and case studies act like data points—signals that they’re willing to learn more. - Desire = Analysis
In the middle of the funnel, prospects compare you with alternatives. Here’s where you present benefits, proof, and credibility, the evidence that tips the balance in your favor. - Action = Conclusion
The final step in the experiment. A strong CTA, a clear offer, or a risk-free guarantee seals the deal. Your hypothesis is proven or disproven by whether they convert.
Some marketers label this TOFU, MOFU, and BOFU (top, middle, bottom of funnel). Different labels, same lab process. The key is this: if one stage fails, the entire experiment does too.
A/B Testing = Your Lab Experiments

A/B testing is marketing’s version of a lab experiment: one control, one variable, and results that decide the winner. Instead of guessing, you’re running proof-based experiments that show exactly what works.
Each stage of your funnel has its own challenges. By tailoring your tests, you can optimize the customer journey step by step.
Top of Funnel (Awareness & Interest)
Here you’re trying to capture attention. Small tweaks here decide if people stay or bounce.
What to A/B test:
- Headlines & Value Propositions → Short vs. long, emotional vs. logical.
- Hero Images vs. Videos → Does a demo outperform a static image?
- Ad Creatives & Copy → Compare different messaging styles on Google, Facebook, LinkedIn.
- Landing Page Layouts → Minimalist vs. content-rich.
Example: One version says “Save Time With Our Tool”, another says “Cut Your Workload in Half.” Both highlight benefits, but A/B testing proves which resonates more.
Middle of Funnel (Consideration & Engagement)
Now it’s about building trust and reducing friction.
What to A/B test:
- Social Proof Placement → Testimonials above the fold vs. further down.
- Content Offers → Free guides vs. webinars as lead magnets.
- Email Subject Lines → Urgency-driven vs. value-focused.
- Form Length → Shorter forms vs. detailed forms.
Example: Testing whether a “5-star Trustpilot badge” right under the CTA outperforms having it buried at the bottom.
Bottom of Funnel (Decision & Conversion)
This is where conversions happen—or don’t.
What to A/B test:
- CTA Wording & Placement → “Book a Free Demo” vs. “Start Saving Today.”
- Pricing Page Layout → Monthly vs. yearly defaults, or highlighting the “most popular” plan.
- Guarantees & Risk Reducers → Adding “30-Day Money-Back Guarantee” or “Free Trial.”
- Checkout Experience → One-page checkout vs. multi-step.
Example: An e-commerce store boosted conversions 20% by changing a CTA button from grey to green—because green signals “go.”
By running tests at every stage, you’re not throwing darts in the dark. You’re conducting structured experiments where every win compounds into measurable growth.
Data = Your Microscope
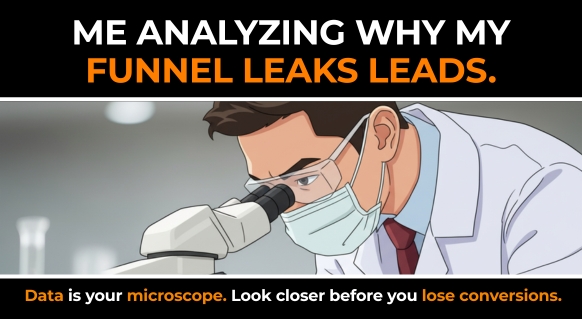
Running tests is easy. Reading the data like a scientist is what drives real growth.
“Data is only valuable if you act on it. The best marketers aren’t drowning in numbers—they’re focused on the insights that drive real growth.” — Gabriela Paiva, Director of Marketing, Digilatics
Here are 4 rules:
- Look Beyond the Numbers
A spike in clicks doesn’t prove success. Make sure your test has enough visitors to show the result isn’t random. - Spot Patterns, Not Just Wins
One metric won’t tell the full story. If everyone drops off at your third form field, that’s friction. If your email gets opened but no clicks, your relevance is off. - Connect Metrics to Goals
Vanity metrics (traffic, time on page) look good but don’t always mean revenue. Ask: does this lead to more booked jobs or sales? - Prioritize High-Impact Fixes
Fixing a tiny bounce-rate issue won’t change your bottom line. Fixing a checkout leak that loses 30% of customers will.
And remember: optimization is a feedback loop:
Test → Measure → Learn → Improve → Repeat.
Tools = Your Equipment
Like any good scientist, you need the right tools.
- GA4 Funnels
Track the exact steps from “Add to Cart” to “Checkout” and see where people drop off.
- Heatmaps (e.g., Hotjar)
Visualize where users click, scroll, or ignore your page. If your CTA button gets no attention, you’ll see it instantly.
Example: One HVAC company saw that nobody scrolled far enough to see their booking button. Moving it higher on the page doubled their form fills.
Other key metrics to watch:
- Conversion Rate: % of visitors who take action.
- Bounce Rate: Are pages grabbing attention or losing it fast?
- Time on Page & Scroll Depth: Is your content engaging?
- Exit Rate: Which pages cause people to leave?
Together, these tools act as your roadmap for experiments.
Final Word: Great Marketing = Good Science
Funnels, A/B tests, and metrics aren’t just buzzwords—they’re the backbone of predictable growth. But knowing what to test and where to act can feel overwhelming without expert eyes on your data. That’s where Digilatics comes in.
Remember, great marketing is just good science.
- Form a hypothesis (your funnel).
- Run the experiment (A/B testing).
- Measure the results (conversion data).
- Refine and repeat until you’ve cracked the formula.
Funnels don’t fail because people aren’t interested. They fail because the leaks go unchecked.
So don’t guess, test. Don’t assume, measure.
👉 Let’s turn your funnel into a high-converting experiment that passes every test.